
Platform module Roadmap module
Performance Reporting & Dashboards
KPIs and management reports generated from live data, instead of a deck assembled by hand at month end.
Live, not pasted
The number on the board is the number in the register.
Month-end reporting usually means exporting, pasting and reconciling — and the deck becomes a second version of the truth that nobody can trace back. Here every tile and chart reads the governed tables the registers write to, so a figure can always be clicked back to the records behind it.
Scroll the image sideways to read it →
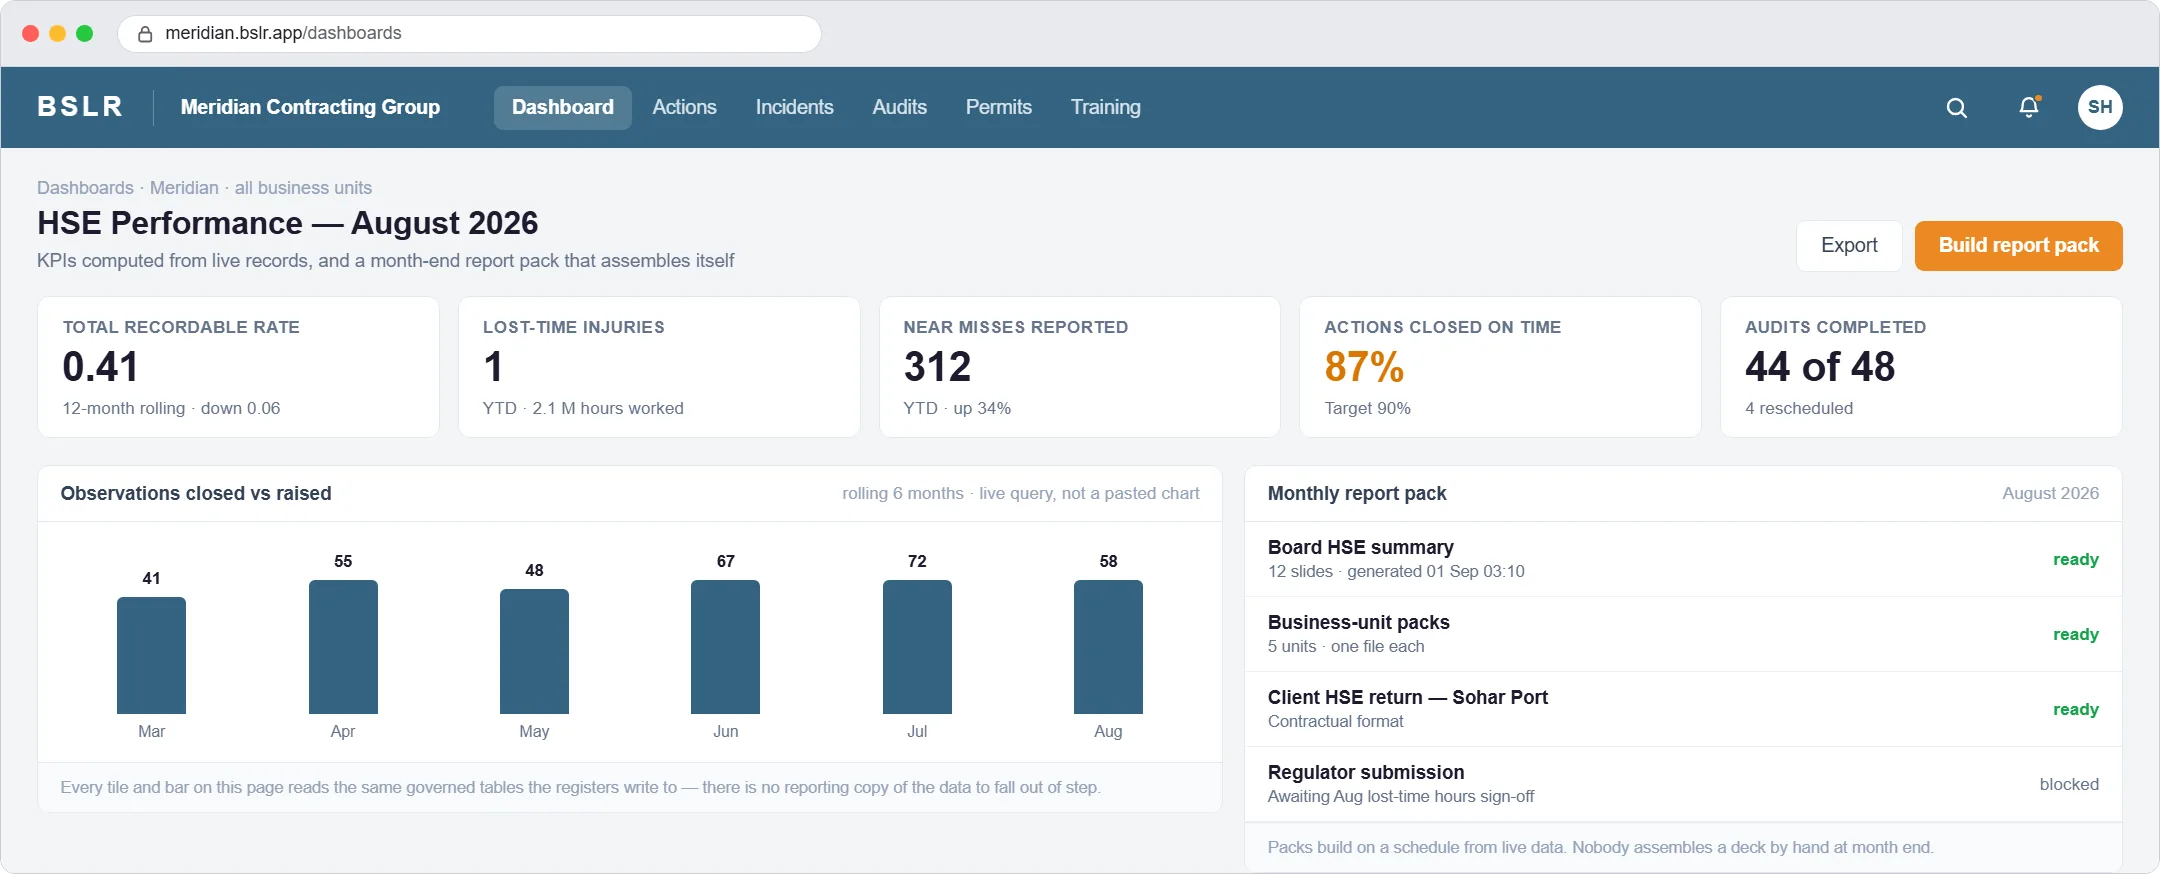
The dashboard — KPIs computed from live records, with the month-end report pack built on a schedule and one item honestly blocked.
BSLR product interface · illustrative data, fictional tenant “Meridian Contracting Group” · Roadmap module
Held to the same governance as everything else.
One source, no reporting copy
Tiles and charts query the same tables the registers write to. There is no export step for the numbers to drift in.
Traceable to the record
Every figure resolves back to the actions, incidents or audits behind it, so a challenged number can be answered rather than defended.
Packs build on a schedule
Board summaries, business-unit packs and client returns generate from live data on a schedule, rather than being rebuilt by hand each month.
Blocked is shown as blocked
A pack waiting on unsigned data says so instead of quietly publishing an incomplete figure — which is the failure mode that erodes trust in reporting.
Scoped to the reader
A unit manager's pack carries their unit; the board pack carries the group. Same engine, same definitions, different scope.
Definitions held once
Rate and frequency definitions live in one place, so two business units cannot quietly compute the same KPI differently.
Observations raised, by month
Rolling six months.
Total recordable rate — 12-month rolling
Descending is improving: 0.47 down to 0.41.
Illustrative figures, fictional tenant “Meridian Contracting Group” · Roadmap module.
Built around ISO 45001 §9.1 monitoring and measurement, and §9.3 management review.
Bring us your last monthly HSE deck.
Thirty minutes. We will trace three numbers on it back to the records they came from.